Showing posts with label market summary. Show all posts

Saturday, September 10, 2011

The only thing that matters on the S&P 500

I apologize for not posting here in over a week. This blog is meant primarily as a place for me to share longer term swing trade idea, but this kind of volatile market has simply not been conducive to that. This kind of market is best traded on a scalping basis and with good deal of caution.

With that being said, I am watching the longer term forecast for the S&P 500 very closely. As I've posted several times before, I will maintain an upside bias until certain technical factors change. Right now, the one technical factor I'm watching is the bottom trend line on the SPY daily chart (in green below).


As far as I'm concerned, if this trend line holds, the market may continue to trade higher. If it breaks, stocks will almost certainly trade lower. Interestingly, the SPY hit this level almost exactly late on Friday and just barely held. Monday will be important test in determining if we bounce into the next several days or begin to trade down.

It's also important to note that we are trading within a macro bear wedge (sharp down move followed by a secondary move sharply higher), as I've mentioned previously. This means that it's only a matter of time before the market breaks, and a break of this green trend line could be a foretelling indicator of that happening.

Tuesday, August 30, 2011

No change in outlook for S&P 500

This weekend I posted that I'm expecting some short term upside on the major market indices based on sideways consolidation on their daily charts. My position remains unchanged as we've seen this scenario play out.

Yesterday the S&P 500 traded up sharply and today closed flat. If we see another one or two days of flat to moderate downside trading, I expect to see another leg up into resistance at the 1250 level. I will look to short a hit or break of this level as it will complete the macro bear wedge that's been forming on the daily chart.


If we don't see consolidation, either by a large move up or down this week, I will switch to a neutral bias on the markets and will not hold any overnight positions. Ideally, any consolidation will take place within the range of the large up move created by Monday's rally.

Tuesday, August 23, 2011

Trend line breakouts--identifying prevalent patterns

Every day I see hundreds of chart patterns play out. Some patterns I take note of while other less reliable ones I ignore. This can vary on a weekly or even daily basis. Today, my chart pattern of choice was the trend line breakout.

To find a trend line, simply connect multiple highs or lows with a line--the more pivots that connect, the better the trend line. Notice how this works on the SPY intraday chart below. I personally played this breakout for a move to approximately 115.25.

SPY 10 min shows clear break of trend line leading to higher prices

Trend lines are a useful addition to any trader's repertoire due to their reliability and straightforwardness in knowing when the trade is working in your favour or not. A break above the trend line is the buy signal and a break back below is the stop out.

Once a trend line has been identified on one of the major indices it's very likely that this pattern will repeat itself on individual stocks. The following charts are trades I took in sympathy to the SPY pattern above.

Notice the POT.to trend line double as an inverse head and shoulders pattern

Trend lines can also be bought on a retest of the initial breakout

The 200MA was the logical target on this SU.to trend line breakout

Identifying prevalent patterns from one day to the next is just as important as identifying key active stocks and sectors. When you see a pattern playing out in the major indices and key large cap stocks, you'll likely see it elsewhere as well. This is a strategy I use in my own trading every day.


Thursday, August 18, 2011

Deja-vu all over again for markets

Today the S&P 500 closed sharply lower, falling nearly 4.5% on the day. This fall was dramatic, but not entirely unexpected. Yesterday I posted about the possibility of a fall as we were trading within a macro bear wedge on the daily SPX chart.

The potentially bullish consolidation we saw over the last two days is now off the table. I recognized the distinct possibility for this consolidation to fail but I'll admit that I didn't foresee a return to the kind of trading we saw during the plunge last week. However, reviewing the charts late last night I noticed a pattern repeating itself.

In late July, the SPX put in a top and began to consolidate within a large green candle. It appeared to me, and others, that the market was due for a short term push up before ultimately falling. Of course, this was not the case as global indices would fall precipitously shortly after, negating the bullish consolidation.

July 21-26 consolidation fails just before precipitous fall

This week, we saw a very similar situation unfold. We had sideways, potentially bullish consolidation within a larger bearish pattern and expected a small push up before ultimately pushing back down. Instead, we saw the micro bullish pattern fail, triggering the macro bearish pattern as well as massive selling.

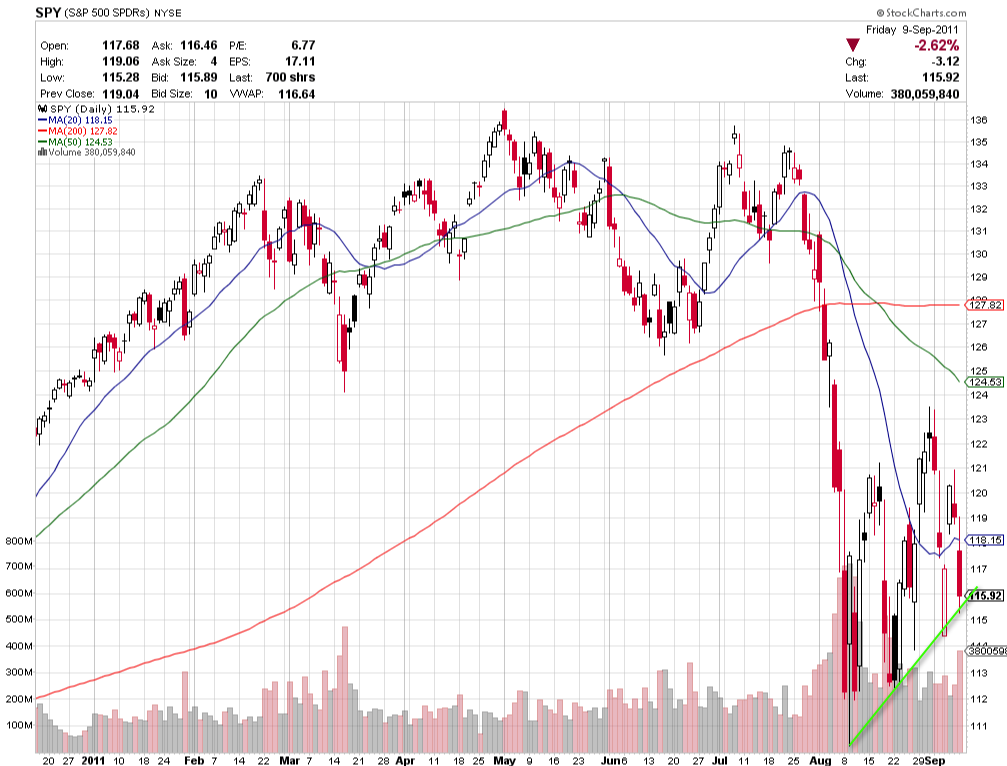
A similar failed bullish pattern to July's huge decline

None of this is surprising, especially when the market is as fragile as it has been over the past few weeks. But what it tells us is that we can continue to expect short term patterns to fail as long as extreme volatility remains.

The August 9th bottom is still intact and, as long as we don't close below it, it has to be respected. I will be referencing the fib levels in the chart above for support and resistance as we trade up or down.


Going forward, I will be closely monitoring the progress of the longer term bearish wedge on the SPX chart. Should it play out to completion, we could expect a break of the Aug 9 bottom and a plunge much lower in the coming weeks. However, I don't expect this to happen all at once, nor do I expect it to happen without dramatic bounces along the way. This is why it's so important to trade prudently and carefully as being on the wrong side of a trade in this kind of environment can lead to especially big losses.

Wednesday, August 17, 2011

Markets grind sideways setting up for possible move higher--then lower

The S&P 500 continued to grind sideways today, closing positive by just .09%.  This is in line with my expectations as outlined in yesterday's post.

As long as this market trades sideways, the odds increase that we see a push higher in the coming days or early next week.

Note the bear wedge pattern outlined in green arrows

Please note that we are still trading within a macro bear wedge pattern signalling that the markets will ultimately trade lower whether or not we trade higher first. This means that we are looking at two trade setups within a single pattern: (1) bullish consolidation to push us higher into resistance and (2) a pullback from that resistance triggering the bear wedge.

Tomorrow, I will be looking for an additional day of consolidation before I am convinced of a move higher in the short term. If we break lower first, the bullish pattern will be negated and will trigger the bear wedge.  And if we trade higher, as I suspect we might, I'll look for resistance at the fib levels in the chart above.

Tuesday, August 16, 2011

Doji candle signals indecision for SPY

Today the S&P 500 (SPY) daily chart ended in a doji formation. This is a classic sign of indecision in the markets.

To match this indecision, we have (possibly) the beginnings of bullish consolidation within an overall bearish wedge pattern. Note the sharp down-move followed by a sharp up-move compared to the sideways trading of the past two to three days.


What this tells me is that the market is poised to eventually move lower (bear wedge), but may need to move higher before doing so (bullish consolidation). If this is the case, I would expect a push into the 50% or 61.8% fib retrace levels before pulling back.

Tomorrow's trading will be the ultimate test of this thesis and if there is a significant pullback I'll revise my analysis. The ideal scenario is another day of sideways trading followed by a push into the upper fib levels and moving averages. But rather than to go long, the better risk reward play here is to go short at the resistance.

As the chart unfolds, I'll be updating my forecast. Check back here and follow me on twitter for my latest thoughts.

Monday, August 15, 2011

Markets float ahead of Merkel/Sarkozy meeting

The markets are, for the time being, beginning to normalize. This is a welcome change from the huge, almost untradable, volatility and whip-saws we've seen over the past two weeks.

The major indices have had sizeable bounces from the pivot low I called out last week. There has also been a drastic decrease in volume (from over 600m shares on the SPY last week to just under 120m currently) and this has helped to lifted the markets as well.

The markets are trading mostly sideways today as traders wait for the outcome of a meeting between the leaders of Germany and France tomorrow. This is a difficult trade as most stocks are well off their lows and any negative reaction could cause a pullback. On the other hand, volume is light and a positive reaction could easily lift prices.

Technically, the SPY is floating up within a larger bear wedge pattern. Notice the big down-move followed by an up-move in the chart below. The dotted blue lines will be good resistance, if we make it there.


Most professional traders have been trading lightly or not at all these past weeks. This is the prudent way to approach this market as it is still fragile and prone to whips and "aftershocks". As a technical trader, I step aside when macro-economic and geopolitical events take centre stage. This is why my twitter and blog have been much less active lately.

Thursday, August 11, 2011

Possible bottom still in place

The possible bottom I posted about on Tuesday is still in play. I will continue to hold this belief until we close below the daily low of 1101.54 sometime in the next few days.


Going forward, I expect to see more upside. However, be careful as the market is still jittery and prone to selloffs.

As the market normalizes, I will be posting more trade setups. Check back often and follow me on twitter for my latest thoughts.

Tuesday, August 9, 2011

Possible bottom on the SPX?

Today the S&P 500 traded all over the map. The index opened higher and traded up for most of the day before flushing sharply lower on the announcement from the Federal Reserve that interest rates would remain low until at least 2013. After the initial flush, the major indices rallied to make new highs on the day.

From the low of today to the close, the SPX closed up over 70 points. This sort of action, combined with very high volume, is a sign of a possible reversal.

If this rally holds into the open on Wednesday morning, I am very cautiously calling for a short term bottom in the markets. I bought a small long position in the SPY shortly before the close of trading and it is already trading up sharply higher. If the rally holds, I'll be looking to sell at the following resistance levels:


Each dotted blue line corresponds to a fibonacci retracement and/or a pivot low or high. The SPX can easily pull back at any of these levels, but I think the best resistance will be at the 61.8% retracement at approximately 1250.

Monday, August 8, 2011

The flush continues

Today the S&P 500 fell another 6.66%. Technical support levels are giving only minor intraday pauses instead of the normal multi-day bounces we normally see. For the time being, fear is leading the market.

As long as this continues, I will only be trading intraday. Even though I believe that most stocks will have have huge rebounds when the market turns, right now it's simply too risky to hold significant positions overnight. The only position I continue to hold is a small short hedge on the SPY I took out against long swing positions I've since been stopped out of.

Until the market normalizes, I will not be posting any swing trade setups. When the market bounces, all stocks will bounce. But be careful and do not try to catch falling knives under these conditions.

Wednesday, August 3, 2011

Wild trading leads to possible bottom on the SPY

Wednesday's trading was all over the map. The market opened flat and inched up before flushing dramtically lower, going from nearly 126 to 123.50. From there, the SPY staged an incredible rally pushing up to close near new highs on the day. This is an impressive move for a market that has seen seven powerful down days in a row.

A big flush followed by a huge rally on SPY 10 Min

The market was and is long overdue for a bounce. Financial turmoil in the EU and the US has created an enormous amount of fear and that tells me a short term bottom may be in place.

Technically, the daily SPX chart has a bottoming tail indicating the potential for higher prices in the days ahead. Until we close below this tail, I'll keep an upside bias on the markets. If I'm correct, expect a move back to a 50% or 61.8% fib level before ultimately trading back down.

A bottoming tail signals the potential for higher prices on the SPX

Because this is the first up day after several down, I'm keeping my analysis simple until a bottom is confirmed with a followthrough move higher. When and if that happens, I'll have more concrete support and resistance levels.

Going into the rest of the week I will be trading very carefully until I have a better handle on the direction of the market. Tomorrow's close will be telling.

Thursday, July 28, 2011

Markets pause as the US House votes on key debt resolution

Tonight's market wrap-up will be brief as there isn't much new to report. The markets gyrated up and down today before closing the session flat. This isn't unusual after a big move in either direction, but today it's mostly due to traders waiting for the US House of Representatives and Senate to vote on Speaker Boehner's plan to raise the debt ceiling.

The outlook for tomorrow is simple. If the House votes yes and the Senate votes no, I will expect a moderate decline in the markets. If both the House and Senate vote yes or no, I'll expect either a large rally or a large fall respectively.

The only way to handle situations like this is to tread lightly. I'm positioned mostly in cash with just a few long positions because I think a deal will eventually be struck. I'm also holding a small short hedge just in case we see further selling if no deal is reached tonight--or worse, if no deal is reached even by August 2nd. I will not be breaking the bank no matter what the outcome is.

Tonight I will be watching the futures closely to see how they react to the US House vote. I suspect that if it passes, the markets will take it as a sign of Speaker Boehner finally getting his party in line--even if the Democratic held Senate votes it down as promised. If not, it indicates that a consensus between the two parties by the deadline is increasingly unlikely.

Tomorrow's trading will be interesting to say the least. Stay nimble, and good luck.

Wednesday, July 27, 2011

Debt fears drive markets sharply lower

Today the S&P 500 gapped lower and continued to sell for the majority of the trading session. Traders and investors are clearly nervous that members of the US House and Senate will not be able to reach an agreement in the short term.

As I posted yesterday, I expected increased volatility as we near the August 2 deadline--and volatility usually means selling. However, even I was surprised by the ferociousness of today's sell-off.

Technically, the daily $SPX chart suffered a lot of damage. Both the 61.8 fib and the 50 moving average support levels were broken and prices closed near the lows of the day. However, it's difficult to put much meaning into this sell-off as it was driven purely by fear and not technical factors.

Fear drives the SPX daily below several key support levels

Whatever the reasons, I'll continue to use the charts as my guide. The markets are now very oversold and due for at least a short term bounce, but when that will happen is anyone's guess. My suspicion, as I've written about previously, is that once a debt agreement is made in the US the markets will rally.

Irregardless of an agreement, the SPY filled a key intraday gap today and that alone may be indicative of a bounce in the coming days. I personally took a small long position close to this level as I believe the markets are due for some short term relief. If we continue to fall tomorrow, I will re-evaluate this position based on several factors such as decline velocity and volume.

Gap filled after near continuous selling on SPY 10 min


Please note that even though today's sell-off surprised me, I did not expose myself heavily to the long side--instead opting to slowly accumulate on the way down. The advantages to this approach are minimal losses and the opportunity to buy stocks at lower levels. It is especially important to remain prudent when there are so many political and economic unknowns looming in the near future.

Going forward into the last half of this week, remain cautious and do not weigh yourself too heavily on the short side. The market is incredibly fearful right now and that usually signals that a turning point is near.

For my latest thoughts throughout the day, be sure check here regularly and follow me on twitter.

Tuesday, July 26, 2011

Markets grind sideways towards the US debt ceiling deadline

Today's trading on the S&P 500 followed the same pattern we've seen over the last several trading days. The index opened flat at 1337.39 and then traded down as low as 1329.59 before catching a bid back up to the 1338.51 level. From there, profit taking and lingering debt fears pushed prices back down to close towards the lows of the day at 1331.94.

Whips on the SPY 10 min continue during Tuesday's trading

This kind of trading will persist as long as the US debt crisis remains unresolved. What we're seeing is panic driving futures lower leading to either a gap down in the indices or follow-through selling pushing down prices in the early morning. From there, dips are bought by large funds causing steep rallies in stocks and flat closes on the markets.

As the August 2 deadline approaches without a US debt deal passed, I expect investor jitters to increase as well as volatility in the markets. This was evident today as prices sold off sharply into the close--no doubt traders are looking to protect profits into the after-market session. But as I've mentioned in previous posts, I'm anticipating a relief rally on stocks once an agreement is inevitably made between the two US political parties.

On the daily chart, not much has changed since yesterday. We're still consolidating within Thursday's sharp move up and are trading above the 20 moving average and several key Fibonacci support levels. Assuming a deal is reached before the deadline, and prices don't sell-off, an agreement is the perfect catalyst to cause a rally up from this consolidation pattern and possibly even a hit of the 52 week highs towards 1370.

Consolidation on the SPX could push prices higher in the coming days

Tomorrow will be another mixed bag as the market digests a combination of positive earnings and debt fears. As these factors will effectively cancel out any momentum in either direction, I'm not expecting much action aide from intraday whips.

Be sure to check this blog daily and follow me on twitter for my latest thoughts on the market.

Monday, July 25, 2011

Markets continue to whip as debt negotiations stall

By this point it is cliched, but also accurate, to say that US debt ceiling negotiations are driving the markets. Events in the European Union, such as Greece's downgrade by Moody's last night, are now merely an afterthought to global traders--at least for the time being.

This morning the S&P 500 opened sharply lower as "bi-partisan" negotiations seemingly broke down over the weekend. But within 20 minutes of the opening bell, the S&P 500 easily started its climb back up to Friday's close at approximately 1345 on the SPX.

Market whips continue on the SPY 10 min chart

The day's rally lasted until midday, when the market topped at the gap-fill and started to decline, this time accelerated as US Republicans and Democrats traded barbs and publicly rejected each other's proposal. The drop continued for the rest of the session, with the SPX closing at 1337.43--more or less flat on the day.


Right now, the pattern on the daily SPX chart is the beginnings of bullish consolidation--a move up followed by several days of sideways trading within the range of the initial up-move. The longer we see sideways trading, the more likely that we eventually trade higher and approach the daily double top at 1370. This pattern confirms my suspicion that if a a debt resolution manages to pass the House and the Senate, the markets will rally as a sign of relief. And please note that the market does not care if it's a Republican or Democratic plan that passes, as long as this uncertainty comes to a timely end.

I have every confidence that a deal will pass by the deadline--to do otherwise without a contingency plan would be political suicide for all parties involved, not to mention the collateral damage to financial markets.

Going into the rest of the week, continue to follow the charts and consider news events only as a means of understanding the intraday whips of the market. We're still in an uptrend, though admittedly extended on the charts, and will remain so until we either hit resistance on the way up or break back to the downside. In the meantime, expect the whips and saws to continue until there is some sort of resolution.

Thursday, July 21, 2011

Another big up-day for the SPX

The S&P 500 traded sharply higher today up nearly 18 points, or 1.35%. This rally came presumably on the back of good earnings reports and optimism that US debt ceiling negotiations may be close to an end. Progress in Europe in securing a bailout packages also helped to buoy prices.

Readers of this blog will know that I don't believe in fundamental explanations of market moves. As I've written numerous times, this 50 point rally we've seen so far since Monday is based simply on technicals and contrarian market psychology.

You'll recall from my previous posts that last week the market was oversold, overly-bearish and into technical support at a key 61.8% Fibonacci retracement level. Interestingly, traders last week and over the weekend were as bearish as they've been in years--this is what gave me the confidence to call not only for a pause but a significant bounce in prices this week.

Monday's hit of 61.8 fib level leads to big bounce on SPX

Psychology plays an important role in determining the short term cycles of the market as big financial institutions look to shake out smaller traders from their short positions and devalue their put options. Once these same traders have been discouraged enough and become bulls, you can be sure the market will reverse and correct downwards. Combine this this contrarian psychology with good support and resistance levels and you will see powerful moves in the market.

If you were monitoring intraday trading on the SPY or any other major market index, you saw these concepts in action on a micro level. At approximately 12:40pm ET, the SPY rallied sharply on a rumour that debt negotiations had concluded, only to fall back sharply 10 minutes later on another rumour that a deal had not been reached. Both of these reports turned out to be either inaccurate or unsubstantiated and the SPY continued to trade upward as normal.

SPY 10 Min whips up and down then continues sideways

Going forward, I'm no longer strongly bullish although I think the likelihood of further upside tomorrow is reasonably high. I mentioned earlier this week to look for resistance at the 1340 and 1356 levels on the SPX. Today, we breezed through 1340 but 1356 should continue to act as resistance should we reach it. I may consider picking up some short positions if we reach 1356, but I will keep them small and maintain a tight stop.

Check back here regularly and follow me on twitter for my latest thoughts on the market.

Wednesday, July 20, 2011

A day of rest for the markets

After a big move up or down, the market usually needs a day of rest before continuing on its way. Today was no exception as the S&P 500 traded mostly sideways and closed fractionally lower on the day.

Today's SPX candle is known as a doji--something created when the price trades within a narrow range throughout the day. A doji means indecision, and that's fitting considering the mix of good and bad economic and earnings news traders have been digesting over the past several days. I expect we'll see a continued move up tomorrow, but any surprise news regarding European or US debt issues overnight could complicate things.

As I explained yesterday, don't be distracted by earnings when trying to make sense of the bounce we're seeing. The current up-move is simply a factor of technical support and contrarian psychology. Continue to hold any longs you may have picked up and be sure to have breakeven stops for each of them.

I'll be watching closely as the charts unfold and will have good resistance levels as they approach.

Tuesday, July 19, 2011

"Surprise" rally crushes bears

Today the markets rallied sharply, catching quite a few traders off-guard. But for anyone who reads this blog or follows me on twitter, it shouldn't have come as a surprise.

Yesterday and late last week I called for a bounce based on technical support and market psychology. Today's trading shows me that I couldn't have been more correct.

Nothing but upside since yesterday afternoon on SPY 10 min

The SPY opened the session up at 131.34 and then pushed further as high as 132.89. As you can see, the 61.8% fibbonacci level from yesterday held beautifully and today we saw more follow-through to the upside. The fact that so many traders are/were bearish I'm sure helped to propel prices as they got squeezed out of their positions.

Do not be distracted by all the talk of good earnings, etc. This is still a weak market with lots of underlying problems and will continue to be so for the foreseeable future. This is simply a relief bounce based on good technical support and a contrarian move to punish traders who over-shorted the market. Rest assured that prices will eventually fall back down just as quickly as we saw them rise today, but until that time we will enjoy the ride up.

I'll continue to look for more follow-through upside into this week. Any long positions should do well as this rally appears to be broad-based.


Huge bounce off of 61.8 fib level with follow-through today

I'll keep this update brief as there is little to discuss. Assuming we continue up tomorrow, look to start taking profits first at the 1340 level and then at 1355 on the SPX.

Monday, July 18, 2011

Monday Market Summary

Today the markets saw some sharp selling as European and US debt fears continue to irk traders. The SPY opened at 131.08 and fell as low as 129.63 before recovering to close at 130.61.

Big drop and nice recovery on SPY 10 min


Despite this selling, I continue to hold a slight upside bias for the short term. I think the markets are currently oversold and that the debt fear premium has been priced in for the most part already. The SPX broke the daily 20 moving average but still should have some short term support at the 61.8 Fibonacci retrace.

Good bounce off 61.8 fib on SPX daily


I still continue to hold a small position short the SPY via the HSD.to 2x ETF, as well as another small short in FTS.to. On the long side, I have a position in GIL.to based on the hit of the double bottom at 31.79 and another position in PG based on bullish consolidation above the 20 moving average.

Going forward into the week, I'll be watching the news and futures closely pre-market and after-hours. Debt negotiations in the US have overshadowed issues in Europe for the time being and traders are watching it with full attention. The market has priced in a lengthy, last minute agreement between Republican and Democrats which means an early resolution will cause a rally and no resolution will cause a fall. No debt resolution is a very unlikely scenario, in my opinion.

Tonight I'll be scanning for long setups in the event that we bounce as I expect we will. If we break lower, I'll simply look to buy stocks at the next set of levels down on the charts.

Saturday, July 16, 2011

Friday/Saturday Market Summary

Trading on Friday ended with a small push up into the close. This wasn't entirely unexpected as Friday's tend to see less trader participation later in the day and that typically favours the upside.

Readers of this blog know that I've been calling for downside since last week, even in the face of the big rally we saw that brought us nearly to daily all-time highs on the SPY. That prediction ended up being a good one as last's weeks trading has been almost exclusively to the downside. As of now, the market remains weak and in my opinion will continue to be so as long as debt issues in the United States and the European Union persist.

With that being said, it may come as a surprise to some that I'm slightly in favour of some short term upside in the market. My reasoning here is partly based on technicals and partly on market psychology.

On the technical side, the SPX is into some support at a back-test of the blue trendline. This is the same trendline that I expected to be resistance on the way up in late June. Clearly, this was not the case as we surged through it during the Independence Day/Canada Day holiday period. This level also coincides with a 50% Fibonacci retrace and the 20 daily moving average. In addition, the overall chart pattern on the SPX is a bullish wedge/flag/pullback pattern.

SPX has support within a bullish wedge pattern. Does it bounce?

On the psychology side, the average trader out there is incredibly bearish at the moment. This isn't a surprise considering the scary macro-economic issues facing the world right now. But as a contrarian trader and marketician, this tells me that the market could be due for a short term bounce as the big financial players look to shake out those who've positioned themselves too heavily on the short side.

In any case, it's important for readers to understand that I'm neither strongly bullish nor bearish at this point. I'm simply suggesting that the market may be due for a short term bounce before continuing back to the downside. However, if there are any negative developments in either the US or EU debt problems over the weekend, it's quite possible that we break through support levels and continue to correct downwards.

I'll be monitoring the news and futures over the weekend. Follow me on Twitter (@thetsxpert) and check this blog regularly for my latest thoughts and analysis.