Thursday, June 30, 2011

Key level: LLTC Short

Linear Tech Corp (LLTC) hit strong resistance today at $33.27 and pulled back. In the event of more upside tomorrow there will be a good opportunity for a short entry.

There are 3 resistance factors here: the 50 moving average, a gap fill and a previous pivot low. The short is valid anywhere between $33.44 and $33.61. I'll probably look to enter at around $33.50, just above the gap fill.

Key level: INTU Short

In the event of a market pullback, Intuit Inc. (INTU) will have strong resistance between 52.50 and the 50 moving average.

There are 6 factors here which could contribute to a pullback: the 50 moving average, two pivot lows, the 50% fib retrace, a gap fill and a bear wedge candle formation. This is a very similar situation to the markets overall so we'll be looking to it to help guide this trade.


I'll enter this short on a hit of the 50MA but it's valid anywhere above the gap fill at 52.48. Make sure to keep a stop as the market can rise easily during holidays.

Thursday Market Summary

Thursday was another sharp up day in the markets. This should not be a surprise to anyone who reads this blog or follows me on twitter. The S&P 500 index broke through the 61.8% fib level, the 50 moving average, a pivot low and a down sloping trend-line. I think it's possible we go higher to the 1330 or 1345 levels, but we are currently into strong resistance that should bring some sort of pullback.


I took a short position on the SPY at 131.70 and 132.05 via the HSD.to 2x ETF, as per my post yesterday. I also shorted the NASDAQ at around 2773. Both of these positions ended flat on the day.

The timing of these shorts could be better as we're entering into a holiday period. Those who've been following me know that I generally assume an up market in light volume holiday trading. In fact unless we get some kind of horrible news out of Europe, I wouldn't be surprised to see a flat or slightly up day tomorrow. The shorting levels should still work once the holidays are over.

Canadian markets are closed tomorrow for Canada Day. The TSX60 is into strong resistance as well, but I'd like to see it higher before shorting, preferably into the daily 200MA or even the 50MA. I'm less confident that a top is in on the TSX so I left it to short on Monday or Tuesday in case the markets float up again.


I'll be watching the markets on Friday but I expect trading to be extremely light in volume and therefore fairly boring. If I see anything interesting I'll be sure to post it here or on twitter.

Wednesday Market Summary

Wednesday's trading was the same float up we saw on Tuesday and pretty much exactly what I've been calling for since last week. And after three days of trading to the upside, I now have a better idea of when to expect the pullback.

The SPX looks similar to almost every other chart I've been studying lately, both US and Canadian--a sharp down move followed by a sharp up move. This is a classic bear wedge. You'll notice from the chart below that we're heading straight into 4 areas of strong resistance--a trendline, the 50 moving average, the 61.8% Fib and a pivot low. Combine this with the bear flag and you have 5 factors saying to go short. This level corresponds roughly with 132 on the $SPY.


The only wildcard left is the timing. I'll short a hit of the 50MA, but before the holidays are over next week it won't surprise if we trade even higher temporarily. In light of this I may wait until we go slightly above this level to make sure I still get a good entry in that event. In any case, I still feel confident that this area has a high probability of being a short term top.

I'll post an update on the market later today and let you know what I'm thinking on twitter throughout the day.

Update: $SPX hit my targets and I'm now short a small position. The timing of this short could be better, but the levels are still good.

Wednesday, June 29, 2011

Key level: FTS.to Short

Just a few days ago, I alerted via twitter that FTS.to would have strong support at 30.80. Since then the stock has risen $1.38--not bad.

Just as quickly, FTS.to is now high on my list of stocks to short. Assuming the market has 1-2 days left of upside left before pulling back, I like the 32.40 level for resistance. There are 5 factors at this level: the 50MA & 200MA, the 50% Fib and a previous pivot low all within a bear wedge.

This is a high probability short, but if for some reason the market surges I'll be more cautious about taking a position. There is also some resistance at 32.70 and 33.85. 

Update: Today FTS.to went to 32.48 early in the morning and pulled back. I shorted the retest @ 32.48 before it spiked even higher to 32.65. FTS.to then came all the way back below the resistance at 32.40, so the level is still working. We'll see what next week brings for this stock.

Key levels: NXY.to Short

NXY.to is another stock that may have already hit resistance. But in the event of more upside, I like the 21.71 level for a short swing. Just below this level is a range that includes another pivot and a 61.8% retrace--all should act as resistance when the market pulls back.

Tuesday, June 28, 2011

Key levels: CCO.to, FM.to

In the event of a market pullback late this week or early next, I like the following stocks on the short side.

Cameco Corp (CCO.to) will hit resistance at 25.20 and 26.38. The 25.20 level is very close and I don't believe the market has hit a top yet, so I won't be shorting there. 26.38 is a much better level as it has three resistance factors and fits with my anticipated pullback time frame.


First Quantum Minerals (FM.to) may already have hit resistance close to its current levels, but I think the 139.25 and 148 double tops will see good pullbacks as well. Which of the two I actually short will depend on how close the market is to its own resistance levels. This stock has been consolidating for some time so be sure to keep a tight stop in case of a breakout.


I'll be updating this post if I take any one of these trades, so check back or follow me on twitter. I'll be following the markets closely in the next few days and soon we should have a good idea of how the charts will unfold.

Holiday Float Continues

This week's trading has been unfolding much as I outlined in several posts over the weekend. The slow, light volume holiday float up has continued. And while it's been a bit boring to watch, the gains to the long side have actually been fairly substantial.

If you follow me on twitter (@thetsxpert), you'll know that I was looking to pick up several long positions into this week. This included stocks like FTS.to, HSE.to, CNQ.to, IMO.to, ECA.to and SU.to, as well as commodities like oil and natural gas via the HOU.to and HNU.to 2x ETFs. I thought that since the markets were oversold and approaching a holiday period, picking up stocks long into key support levels would be a safe bet. My analysis also showed me that oil & gas were making bottoms, so I concentrated my picks in those areas.


Unfortunately, these stocks came within cents of my entry targets before taking off sharply to the upside--in most cases dollar plus gains so far. The only position I ended up getting filled on was HNU.to and ECA.to, both natural gas related. I'm very happy with their performance but of course I'd be much happier with more long exposure given the gains in the market.

But what the market giveth, it also taketh away. I'd probably be looking to take the gains off the table by now, or close to it. In fact, I was debating towards the end of today whether or not to take profits. I ended up holding as I think we may have a day or two more of upside, but I have breakeven stops in any case.

Both the TSX60 and the SPY are close to some major resistance levels, which you can read about here and here. My position is the same--if resistance levels are hit later this week or early next, I'll short them.


I also think there's a decent chance of going sideways tomorrow. The market appears to have priced in Greece's parliament voting in key austerity measures tomorrow morning. Therefore if the vote passes as expected, the market should hold on to its gains and do little else. Alternatively, a surprise impasse in the vote could weigh on the markets to the downside.

In any case, I'll be looking for trades on both the long and short side so that no matter what happens tomorrow I'll be ready to take advantage of it. I'll advise on my findings later tonight both here and on twitter.

Monday, June 27, 2011

Holding a Middle Ground: US Edition

If you read my Sunday post with thoughts on the direction of the TSX60 in the coming weeks, you'll know I'm expecting flat to upside trading until the Canada/Independence Day holiday week is over. Holiday periods are usually marked by lighter volume trading which typically favours the upside.

My forecast for American markets, or more specifically the S&P 500 index, follows the same line of thinking. Even though I believe the dominant daily pattern on the chart is a bear wedge, volume is simply too light to expect it to trigger this week. Today's steady rise on low volume makes me confident this will continue to be the case.


In light of this, I'll be looking to buy dips--if any--into key support levels while waiting to ultimately short key resistance levels further up in the charts. The idea here is to ride the float up into the end of the week and short resistance levels which will be more likely to play out when volume returns after the holidays.

The levels I'm looking to short are 130 and 131. These levels correspond with previous pivots, the 50 and 61.8% retracements (respectively), the 50 moving average and the fill of a gap. My ideal shorting level is a break of 131 as this is the highest level, carrying the least risk, as well as the convergence of 4 resistance factors.

It should also be clear by now that the timing of any shorts is just as crucial as the entry price. If we reach these levels late Tuesday, for example, I will not be shorting them. Preferably these levels are hit on Monday or Tuesday next week.

Support levels I like are the 125.70 double bottom and the 124.12 pivot low from April 12. If these levels were to be hit in the next few days, I'd have no trouble going long due to the light volume I expect. However, I doubt we'll go that low this week.


As trading progresses and the charts play out, I'll be providing updates throughout the week. Hopefully by Wednesday or Thursday we have a clearer picture of what post holiday trading may bring to the markets.

Key levels: FTS.to Long

Fortis is a chart I wish I had been paying closer attention to on Friday. It fell into key support @ 30.75, which corresponds to a previous pivot low and a long term 38.2% fibonacci level. I like that it's holding the blue trend-line as well.

I will enter FTS.to for a swing long at a retest of friday's lows @ 30.79. I will also consider going long if today's daily chart looks to close with a doji candlestick. A doji is formed when the price closes flat on the day after going both higher and lower.

Of course, any sharp downturn in the overall market will negate this trade.


Update: Fortis closed well above the support levels I mentioned. I'll now look to enter on a hit of the next level down, $30.


Converging Factors: Increasing the Odds

Those who follow my charts know that I only make note of the most important technical factors. However, I never make trades based on any single level. Before putting money on the line, I need to see multiple factors converge.

Some of you may remember when I shorted the TSX60 index in late May. It was a great trade that lead to an almost 70 point decline on the markets. The reason I took this trade is simple--there were 5 resistance levels. 875-880 coincided with 2 trend-lines, the 50 moving average, a previous pivot low and the 61.8% Fibonacci retracement level. No two factors were at exactly the same level, but all came close to converging and indicated that the price would have a very difficult time going higher. You may also notice the bear wedge pattern created by trading up into these levels after the down move in early may--another reason to expect lower prices.

Five factors lead to a big move down
This was clearly an ideal trade setup that's unlikely to repeat itself very often, but using multiple support and resistance levels at once is an easy way to increase the odds of a successful trade

So, the next time you're torn between two trades, make the decision simple and choose the one with the most support or resistance levels in your favour.

Sunday, June 26, 2011

Greece: Worst Fears and a Last Hope

With political and budgetary turmoil in Greece and other EU members intensifying, it's worth considering its effects on the broader market.

I believe the issues in Greece have been skewed. This is not a revenue crisis, rather it's a problem of failing to meet EU fiscal requirements for continued membership. This isn't even to mention the ire that's been drawn from fellow member states like Germany and France who may soon be tasked with bailing it out.

In short, if Greece is to remain a member of the EU in the long term, collective EU budgets will be strained. This will put downward pressure on the Euro currency. Conversely, a Euro unburdened by this responsibility would likely rally in response.

If the worst fear of the market right now is a Greek default, its last hope is a Greek exit from the European Union. In this event, demand for Euros would increase and likewise put downward pressure on the US dollar.

With this in mind consider that the markets often trade inverse to the US dollar (see chart). A strong Euro means a weak US dollar, and a weak dollar typically lifts markets. A Greek exit from the union would relieve investor worries of an EU collapse and make stocks and commodities cheaper to purchase. These are certainly two very bullish cases for markets going forward.

This is not to argue that Greece exiting the EU is in the best long term interest of either Greece or the EU, just that markets would--at least temporarily--interpret it favourably. Looking forward speculatively, one can envision a scenario where removing countries like Greece from the European Union acts as a last ditch bid to boost a failing market and bolster global financial optimism.

How long that optimism would last is anyone's guess.


Holding a Middle Ground

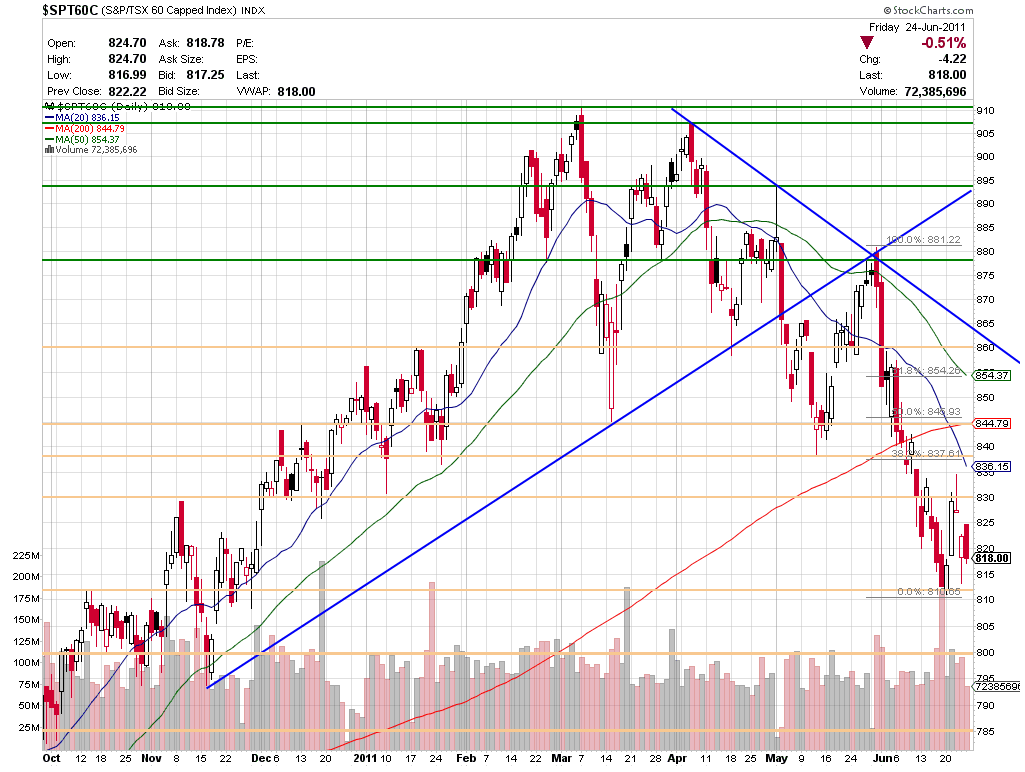
The TSX60 index is holding a middle ground--for now. It's been chopping around at the lower levels of the daily chart since early June with few indications of going higher. Each break above the key 830 price level has been met with heavy selling. This is a bearish sign for the market to be sure.

We've seen continuous, and at times ferocious, selling since late May and the economic outlooks of several of the primary news outlets (CBC, CNBC) have become bearish. As a contrarian trader, I believe that when the market looks the weakest it's usually an opportunity for a bounce. For this reason I will maintain an upside bias for the short term and continue to do so until we trade and confirm below 810.

I see several possible scenarios playing out this week. Ideally, I'd like to see the market trade up into 838, 845 or 855 levels before trading back down. This would be consistent with the bearish wedge pattern we already have forming on the daily chart as well as provide a good shorting opportunity. A bear wedge is a sharp move down followed by a period of sideways to upside trading. However, we've already bounced from the low of 811 and may have technically satisfied the requirements for the wedge to play out. I don't think this will be the case as the upcoming Independence/Canada Day holidays are approaching and light holiday trading volume usually favours the upside.

In the event of upside trading, I will be looking to short the TSX60 index, as well as individual stocks (pattern permitting), on a hit or break of any of the levels I've listed above. I always prefer to short the highest levels, however the 845 level will be good resistance as well as it's the confluence of a 50% Fibonacci retrace, the 200 moving average and a previous pivot low. 838 is also good resistance, but the spike on June 22 nearly hit this level and so I feel less confident shorting there on a retrace.

Alternatively, if the market trades lower Monday, I'll be looking to buy key levels. The 800 to 785 range will be very good support as this corresponds with several key pivots and moving averages on the daily and weekly charts. I believe that these levels will be hit eventually, the question is do we go there this week or following the holiday period. In my opinion, a downward move this week is unlikely.

Please refer to the charts below and feel free to ask questions you may have. Also, be sure to follow me on twitter for my latest thoughts on the market.