The price of the SPY is apparently priced to perfection. I say this because of the sideways trading we've seen for the past couple of days.
Sideways consolidation typically tells us that the market has priced in every bit of available information out there and is waiting for more. In this case, it's the ADP private jobs number to be released Thursday pre-market.
The best way to incorporate the results of this data into your trading plan is to not be concerned with the numbers and concentrate on what the market expects versus what it gets. Right now the market is expecting an additional 60-68k jobs to be added to the private sector. This means that if the numbers come in as expected, it should be another muted trading day as the market has already priced this into stocks. If the market is surprised, things could get more volatile.
A surprise will come in the form of either under-performing or out-performing what the market already expects. This should be fairly self-explanatory--a low number will send the markets down, and a higher number will send them up. And the extent to which it under or out-performs will determine the extent of any move in the SPY up or down.
Personally, I will wait for the numbers to be released tomorrow morning before speculating one way or the other. One thing I will say though is that poor ADP showing will put a dent in an already extended market. The market will need a good number, probably above expectations, to keep a rally like we've had since mid June going strong.
On Friday, Non Farm Payrolls data will be released. I suspect that a neutral ADP number tomorrow will cause the markets to pause again until then before making a move in either direction.
For my latest thoughts on this and other topics, check back here daily and follow me on twitter @TheTSXpert.
Wednesday, July 6, 2011
Wednesday Market Summary
Today the markets ended mostly flat after briefly trading both lower and higher than yesterday's closing price.
The SPY, a key benchmark, ended up just 16 cents, or 0.12%. It opened the session down 32 cents before dropping to 133.11 and pushing all the way back up to the the key 134 level. Between noon ET and the rest of the day, the SPY traded flat.
On the daily chart, the latest candle is essentially a doji. A doji is formed when the price closes flat after moving both up and down during the day. The SPX index (which is what the SPY tracks) formed an even more defined doji candle. This latest doji candle is in addition to the one that formed Wednesday right next to it.
Yesterday I spoke about how a doji candle after a big move up often signals a reversal in trend. I also mentioned that if a second consecutive doji candle were to form, I'd change my analysis. Today we got exactly that. A big up move followed by two flat days is a classic bull flag. This tells me that the market is preparing itself to move upward, or at least isn't adverse to doing so.
Had this pattern showed itself 2 weeks ago, I'd be long the market right now. However, at such lofty levels on the chart I have to leave it alone. Please be aware that bullish patterns at highs and bearish patterns at lows have decreased probabilities of playing out to completion or at all.
This isn't to say that the market won't push up tomorrow--in fact, I'm almost expecting it. The market has been floating up since last week and this latest daily pattern doesn't dissuade me from thinking it will continue to do so.
I'm still holding half positions short in the SPY and the QQQ that I picked up before Friday's sharp rally. The markets are still very extended and are overdue for a retrace. If we don't pull back by Friday, I'll stop out of these positions for a small loss and look to go short again further up in the charts. A push up in the SPY will meet resistance first at 134.30 and finally at the double top at 136.50.
ADP jobs data will be released tomorrow pre-market and it may provide a catalyst for the market to make a move. Stay tuned to this blog and my twitter as I'll be posting about it later tonight.
The SPY, a key benchmark, ended up just 16 cents, or 0.12%. It opened the session down 32 cents before dropping to 133.11 and pushing all the way back up to the the key 134 level. Between noon ET and the rest of the day, the SPY traded flat.
 |
| 10 min SPY chart |
On the daily chart, the latest candle is essentially a doji. A doji is formed when the price closes flat after moving both up and down during the day. The SPX index (which is what the SPY tracks) formed an even more defined doji candle. This latest doji candle is in addition to the one that formed Wednesday right next to it.
 |
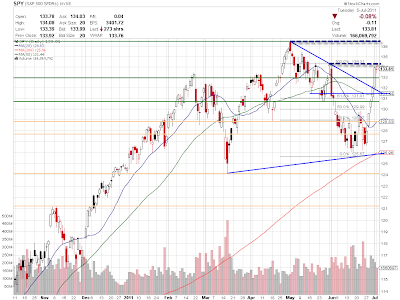
| SPY daily chart |
Yesterday I spoke about how a doji candle after a big move up often signals a reversal in trend. I also mentioned that if a second consecutive doji candle were to form, I'd change my analysis. Today we got exactly that. A big up move followed by two flat days is a classic bull flag. This tells me that the market is preparing itself to move upward, or at least isn't adverse to doing so.
Had this pattern showed itself 2 weeks ago, I'd be long the market right now. However, at such lofty levels on the chart I have to leave it alone. Please be aware that bullish patterns at highs and bearish patterns at lows have decreased probabilities of playing out to completion or at all.
This isn't to say that the market won't push up tomorrow--in fact, I'm almost expecting it. The market has been floating up since last week and this latest daily pattern doesn't dissuade me from thinking it will continue to do so.
I'm still holding half positions short in the SPY and the QQQ that I picked up before Friday's sharp rally. The markets are still very extended and are overdue for a retrace. If we don't pull back by Friday, I'll stop out of these positions for a small loss and look to go short again further up in the charts. A push up in the SPY will meet resistance first at 134.30 and finally at the double top at 136.50.
ADP jobs data will be released tomorrow pre-market and it may provide a catalyst for the market to make a move. Stay tuned to this blog and my twitter as I'll be posting about it later tonight.
Tuesday, July 5, 2011
The FX-factor: Update
This morning I posted about the interesting fact that the stock market has rallied sharply while the Euro--usually coupled with it--barely moved up at all.
Just after posting this thought, the Euro pulled back relatively sharply off the resistance levels I noted. The US dollar bounced as well. At the same time, the market pulled back sharply, as you'd expect, before floating back up for the rest of the day.
As you can see, the decoupling continues. The FXE is pulling back while the SPY pushes up. It's only a matter of time before one or the other gives and either the market falls with the Euro or the Euro breaks up and joins the market.
Tonight I'll be watching the Euro and US dollar futures. If the Euro fall/USD bounce continues, the market will have a difficult time pushing up under any kind of heavy volume.
Just after posting this thought, the Euro pulled back relatively sharply off the resistance levels I noted. The US dollar bounced as well. At the same time, the market pulled back sharply, as you'd expect, before floating back up for the rest of the day.
 |
| FXE (candles) with SPY overlayed (line) |
Tonight I'll be watching the Euro and US dollar futures. If the Euro fall/USD bounce continues, the market will have a difficult time pushing up under any kind of heavy volume.
Mixed Signals
Today the S&P 500 ended flat. This isn't surprising as the market is incredibly extended right now since bouncing in mid June. Even with light volume the market needed a day of rest before going up or down any further.
Yesterday I wondered if the market would go up or pullback today. The signals the market gave us are mixed and require some analysis. Going forward into the rest of the week I think there is an almost equal case to be made for either further upside or a small pullback.
The SPY ended flat and even had a float into the close. Today's daily candlestick ended in the form of a doji. Under the right circumstances, a doji hints at a possible reversal in trend. Idealy, I like to see doji candles form right underneath resistance levels after a extended move--this setup is usually a good short entry for a pullback. We got the extended move and the doji today, but still didn't quite hit the next resistance level at 134.30.
Based on this last candle, there are a few of scenarios that could play out tomorrow. First, the extended move plus a doji could lead to a reversal. In my opinion, this is the healthiest move as we're very extended and it's difficult to go long or short stocks at these intermediate prices.
Alternatively, if we push up into the next resistance pivot at 134.30 we could pull back from there. I will be watching this closely if it's the case as we came very close to hitting this level today and that slightly lowers the odds of it being resistance when it actually hits.
The third option sees us forming a second doji candle on the daily chart. This option is the trickiest because it's still possible to have a pullback, but two sideways days after an up day is very close to creating a bull flag consolidation pattern and hints that there may be further upside still. In this case, we'd probably push all the way back up to the double top. If this ends up being the case, I may decide to cover my shorts just before the close tomorrow just in case.
With these three scenarios in mind, I will be preparing my trades for tomorrow. As the holiday weekend fades, volume should start to re-enter the market and volatility will increase. I'm confident that soon we'll get a move in the market one way or the other and tomorrow might be that day. I'll be watching the futures overnight as that should give us a clue to what might happen.
Yesterday I wondered if the market would go up or pullback today. The signals the market gave us are mixed and require some analysis. Going forward into the rest of the week I think there is an almost equal case to be made for either further upside or a small pullback.
The SPY ended flat and even had a float into the close. Today's daily candlestick ended in the form of a doji. Under the right circumstances, a doji hints at a possible reversal in trend. Idealy, I like to see doji candles form right underneath resistance levels after a extended move--this setup is usually a good short entry for a pullback. We got the extended move and the doji today, but still didn't quite hit the next resistance level at 134.30.

Based on this last candle, there are a few of scenarios that could play out tomorrow. First, the extended move plus a doji could lead to a reversal. In my opinion, this is the healthiest move as we're very extended and it's difficult to go long or short stocks at these intermediate prices.
Alternatively, if we push up into the next resistance pivot at 134.30 we could pull back from there. I will be watching this closely if it's the case as we came very close to hitting this level today and that slightly lowers the odds of it being resistance when it actually hits.
The third option sees us forming a second doji candle on the daily chart. This option is the trickiest because it's still possible to have a pullback, but two sideways days after an up day is very close to creating a bull flag consolidation pattern and hints that there may be further upside still. In this case, we'd probably push all the way back up to the double top. If this ends up being the case, I may decide to cover my shorts just before the close tomorrow just in case.
With these three scenarios in mind, I will be preparing my trades for tomorrow. As the holiday weekend fades, volume should start to re-enter the market and volatility will increase. I'm confident that soon we'll get a move in the market one way or the other and tomorrow might be that day. I'll be watching the futures overnight as that should give us a clue to what might happen.
FXE and UUP: The FX-factor
Last week I posted about how the US dollar and the Euro are key to understanding the market. I explained that I was suspicious of the big S&P 500 rally on Friday because the major currencies did not follow. This week, as stocks continue to float up, my position remains the same.
The Euro typically trades inverse to the US dollar and in synchronicity with the stock market. If you look at the chart below, you'll see that the Euro (FXE) did not participate in Friday's rally nor has it moved up since. Also notice that it has not moved above the key blue trend-line. The pivot high at 144.86 and this trend-line remains strong resistance. These levels roughly correspond with inverted support levels on the US dollar charts.

Unless FXE can trade and close above these levels, I have to be suspicious as the stock market continues to float. I'll continue to stake out good short entries further up in charts and maintain stops on my current positions. If the FXE does breakout, I'll expect the market to trade back up to 2011 highs. If it doesn't, look out below.
Monday, July 4, 2011
FM.to Short Setup
FM.to is coming into good resistance. If the market has another leg up, this short will likely trigger sometime tomorrow.
The short is based on the hit of a double-top at 147.50 after a very extended up-move. The stop should be placed above 147.50 level, using whichever method you prefer.
The short is based on the hit of a double-top at 147.50 after a very extended up-move. The stop should be placed above 147.50 level, using whichever method you prefer.
 |
| FTS.to |
Weak showing for TSX60
The TSX60 Capped Index ended up 0.62% Monday while US markets were closed for the July 4th long weekend. On Friday US markets rallied sharply while Canadian markets remained closed.
As you you'll recall from last night's article, I expected the markets to gap up by approximately the same percentage basis as the US markets rallied Friday. This was not the case as the TSX closed up only by about 1/3 the latest SPY close. In fact, earlier in the morning the TSX was actually trading negative.
This kind of showing is interesting. The fact that the TSX under performed the S&P 500 by a good margin shows that perhaps some of the exuberance of Friday's rally has faded. It also confirms my suspicion that the TSX might lag as it had not yet hit major resistance just above Thursday's close.
If the TSX does continue to push higher it will hit strong resistance at the 860 pivot low and ascending trend-line. If Tuesday's market pulls back, the 50MA at 850.95 will remain a barrier.

With Canada's exchanges re-opened, what remains to be seen is how the US market trades post holiday weekend. The SPY is arguably in a more precarious position as there is no real support until all the way back at 132, the breakout level from Friday afternoon's initial spike. On the other hand if US markets continue up, there's no real resistance until just above 134 and then all the way back to the double top at around 137.

The futures will be re-opening for the week shortly and I'm eager to see how they perform. I'm still short the market and will be looking to get more short in the event of further upside. Personally, I think it's likely that Tuesday is an uneventful day with little price movement either up or down.
If any news is released overnight, I'll re-evaluate my position. Follow me on Twitter to stay up to date with my latest thoughts.
As you you'll recall from last night's article, I expected the markets to gap up by approximately the same percentage basis as the US markets rallied Friday. This was not the case as the TSX closed up only by about 1/3 the latest SPY close. In fact, earlier in the morning the TSX was actually trading negative.
 |
| Float up, fade down. |
This kind of showing is interesting. The fact that the TSX under performed the S&P 500 by a good margin shows that perhaps some of the exuberance of Friday's rally has faded. It also confirms my suspicion that the TSX might lag as it had not yet hit major resistance just above Thursday's close.
If the TSX does continue to push higher it will hit strong resistance at the 860 pivot low and ascending trend-line. If Tuesday's market pulls back, the 50MA at 850.95 will remain a barrier.

With Canada's exchanges re-opened, what remains to be seen is how the US market trades post holiday weekend. The SPY is arguably in a more precarious position as there is no real support until all the way back at 132, the breakout level from Friday afternoon's initial spike. On the other hand if US markets continue up, there's no real resistance until just above 134 and then all the way back to the double top at around 137.

The futures will be re-opening for the week shortly and I'm eager to see how they perform. I'm still short the market and will be looking to get more short in the event of further upside. Personally, I think it's likely that Tuesday is an uneventful day with little price movement either up or down.
If any news is released overnight, I'll re-evaluate my position. Follow me on Twitter to stay up to date with my latest thoughts.
Subscribe to:
Posts (Atom)