I will enter FTS.to for a swing long at a retest of friday's lows @ 30.79. I will also consider going long if today's daily chart looks to close with a doji candlestick. A doji is formed when the price closes flat on the day after going both higher and lower.
Of course, any sharp downturn in the overall market will negate this trade.
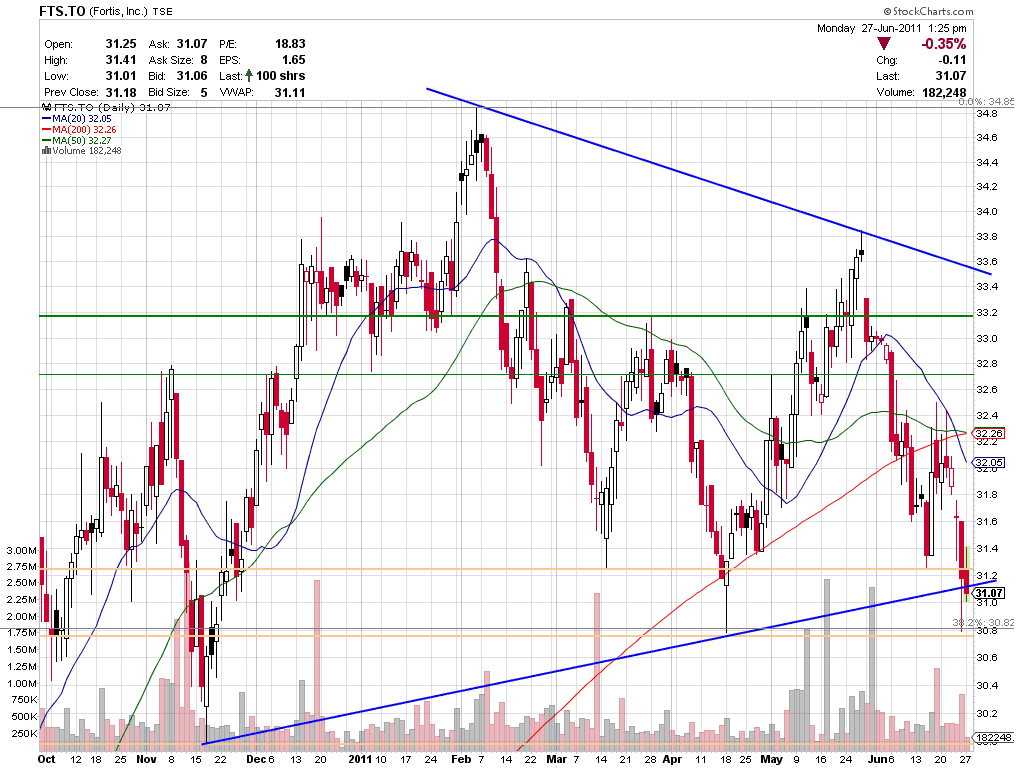
Update: Fortis closed well above the support levels I mentioned. I'll now look to enter on a hit of the next level down, $30.
No comments:
Post a Comment