Showing posts with label trade idea. Show all posts

Tuesday, August 2, 2011

TLT weekly resistance--possible bounce in stocks coming?

The iShares 20 Year Treasury Bond Fund (TLT) has run into major resistance on the weekly chart.

If you connect the last two pivot highs, you form a trendline that stretches all the way back to late 2008. The third hit of any trendline is usually a high probability short, especially when they're as nicely spaced as on the chart below. 


Treasuries often trade contrary to stocks as institutional investors look for refuge in seemingly safer assets. Note the vertical lines in the S&P 500 weekly chart below--this is where each pivot high on the TLT corresponds. You'll notice that each time the TLT makes a top, the SPX is either near or at a sharp up-side move.


It's unclear if this pattern will repeat itself again, but there are several reasons to believe that it might. The market is extremely oversold right now as well as extremely bearish. History shows that when sentiment hits an extreme, it's often a sign that a turnaround is near. This combined with a possible pivot high in the TLT leads me to believe that stocks may be due for some short term upside in the near future. 

If the market does bounce, I won't be expecting much--possibly a retest of the highs at 1350 or 1375. As you can see, the previous two pivot lows in the SPX were consecutively smaller declines leading to shallower bounces. 

I'll be watching this correlation closely in the days and weeks ahead. If Treasuries rally sharply higher from here, or if it pulls back while stocks continue to decline, I'll know the pattern has been negated.

Monday, August 1, 2011

Trade idea: SM long

SM has pulled back over the past week after an impressive up-trend that began in mid June. If it pulls back further, look for support between 70.50 and 71.14.

This range corresponds to three support factors: a 50% fib retrace at 71.14, a previous pivot high at 70.46 and the 50 moving average currently at 70.38.


I will look to take this trade long on a hit or break of the 50 moving average or the pivot high at 70.46--whichever comes first.

Trade idea: WAG long

Walgreen Co., (WAG) will have two important support levels coming up if it continues to decline.

The first level is at 36.68 and it corresponds to a gap fill and a 50% fib retrace. The second level at 34.71 corresponds to another gap fill and a 61.8% fib retrace.


As both of these levels have multiple support factors, both can be entered long for a short term swing trade. For either of these levels, be sure to use an appropriate stop and set it to trailing once in the money.

Trade idea: USB long

USB will have significant support at around 25 dollars if it continues to drop into this week. This level corresponds to a major daily gap fill as well as the 50 moving average.


I will look to enter USB long on a hit or break of 25, though 25.30 will also have good support as it corresponds to a 61.8% fib retrace. I'll keep a stop at a daily close below 25--higher risk traders can put their stop below 24.15.

Sunday, July 31, 2011

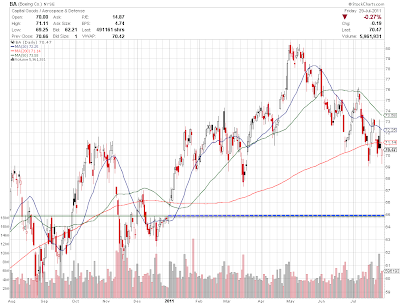
Trade idea: BA long

If BA slides into next week, it will hit an important support level at 64.88.

This level corresponds to a gap fill and is where the stock closed just before a sharp rally that has lasted into 2011. Market permitting, a hit of this level should lead to a significant bounce.


I will look to enter BA long on a hit or break of 64.88 and will stop out on a confirmed daily close just below. Traders willing to take on greater risk can put their stop below the nearby pivot low at 62.46.

Saturday, July 30, 2011

Trade Idea: AEP long

If AEP trades down next week it will have strong support at 36.47, just below the current price.

This level has three factors to support a bounce: a previous pivot high, a gap fill and a 61.8% fibonacci retracement.


I will look to enter this trade long on a hit or break of 36.50, with a stop at a confirmed close below it. If by chance this level breaks, there will be strong secondary support at the 200 moving average.

Tuesday, July 26, 2011

Trade idea: CA long

CA Inc. (CA) could be poised for an inverse head and shoulders breakout if it can confirm above the blue neckline.

Potential inverse head and shoulder on CA daily

I will enter this trade on a confirmed daily close above the blue neckline. If it closes significantly above, I will look to enter on a retest of the neckline. A close back below the blue neckline will negate the trade and initiate a stop out.

Target 1: 24.38
Target 2: 25.06

MCP explodes off of inverse head and shoulders pattern

It pays to trust trust charts and read technical patterns.

Yesterday I posted an alert to enter MCP long at or near the confirmed daily head and shoulders neckline. I entered this trade myself just prior to posting at 59.35. Today, the stock exploded to the upside and is now trading nearly 5 dollars above my entry price, up 7%.

The internet and media are buzzing with buyout rumours and general hype surrounding this stock, but none of it matters. Just read the charts, know the patterns and do what they tell you.


If you entered this trade, sell half at 66 and then set a breakeven stop for the rest of the position. The final target is 72-78, depending on how quickly it trades up.

Monday, July 25, 2011

Trade idea: MCP long

MCP recently broke out of a perfect inverse head and shoulders pattern and could be due for a fairly big upside move. Inverse head and shoulders patterns have a high probability of playing out successfully.

The first target for this trade is $72, at which point I'll sell half and put in a break even stop. The final target is 78, just shy of the double top.

I entered this trade just prior to posting at approximately 59.35, but anywhere near the dotted blue neckline is a good entry. I will stop out on a daily close below this neckline.


MCP inverse head and shoulders

Sunday, July 24, 2011

Trade idea: TXN short

Texas Instruments (TXN) gapped down on July 11 and has since recovered, trading up significantly over the past week. If the stock fills this gap at 32.44, it should meet significant resistance.

In addition to a gap fill, this level also corresponds closely to a 61.8% fibonacci retracement and a previous pivot/area of congestion.


I'll look to enter this short trade on a break of the 32.44 gap fill area and will stop out on a daily close above the 50 moving average.

Trade idea: MS short

MS has had a strong up-move over the past 4 trading days and is short term extended on the daily chart.

Should this stock continue to push up over the next few days, it will have good resistance between 25.50 and the 200 moving average. This level also corresponds to a 50% Fibonacci retracement.


I will look to take this trade on a break of 25.50 with a stop at a confirmed daily close above the 200 moving average.

Saturday, July 23, 2011

Trade idea: Allstate (ALL) Short

In the event of further upside in the market next week, watch ALL for a pullback at 29.50. The stock has been in a significant downtrend since early May and is trading below its 20, 50 and 200 moving averages.

The 29.50 level corresponds to a gap fill and is very near to a pivot low and a 50% fibonacci retrace. Should this level break to the upside, there will be strong secondary resistance at the 20 moving average and the 61.8% fibonacci retrace.

I will look to short ALL on a break of 29.50 with a stop above the 20 moving average.

ALL has strong resistance at the 29.50 level