Despite this recapture, there is still a lot of resistance at these levels. Going forward into Friday and early next week I will be looking for a followthrough move to the upside or downside, thereby confirming the levels as cleared or continued resistance. In the meantime, my outlook on the TSX 60 will remain neutral.
Showing posts with label key levels. Show all posts
Thursday, September 15, 2011
The TSX 60 recaptures the 20 moving average--just barely...
Today the TSX 60 index recaptured the daily 20 moving average. You'll recall from my analysis earlier this week that I was calling for a float up into the 780 gap fill area. Since then we've seen exactly that and closed today significantly higher at 783.11--just .60 points above the 20 moving average. Because the recapture is so slight, it's difficult to tell if it represents a true breakout or a minor pierce signalling a move lower.
Saturday, September 10, 2011
The only thing that matters on the S&P 500
I apologize for not posting here in over a week. This blog is meant primarily as a place for me to share longer term swing trade idea, but this kind of volatile market has simply not been conducive to that. This kind of market is best traded on a scalping basis and with good deal of caution.
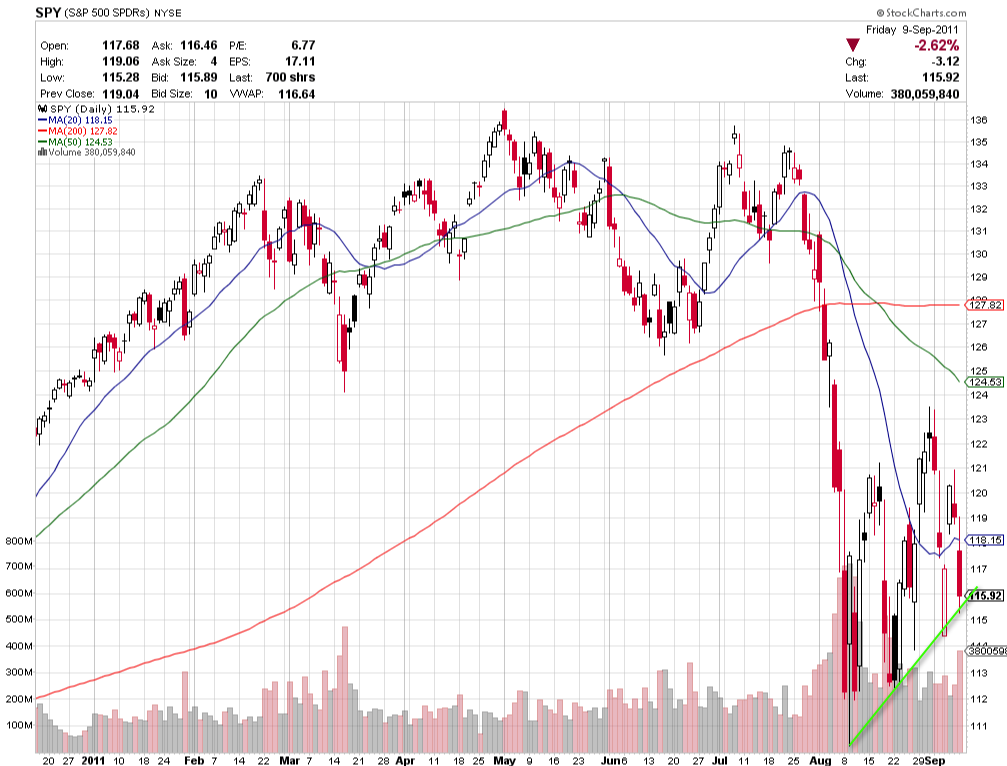
With that being said, I am watching the longer term forecast for the S&P 500 very closely. As I've posted several times before, I will maintain an upside bias until certain technical factors change. Right now, the one technical factor I'm watching is the bottom trend line on the SPY daily chart (in green below).
As far as I'm concerned, if this trend line holds, the market may continue to trade higher. If it breaks, stocks will almost certainly trade lower. Interestingly, the SPY hit this level almost exactly late on Friday and just barely held. Monday will be important test in determining if we bounce into the next several days or begin to trade down.
It's also important to note that we are trading within a macro bear wedge (sharp down move followed by a secondary move sharply higher), as I've mentioned previously. This means that it's only a matter of time before the market breaks, and a break of this green trend line could be a foretelling indicator of that happening.
With that being said, I am watching the longer term forecast for the S&P 500 very closely. As I've posted several times before, I will maintain an upside bias until certain technical factors change. Right now, the one technical factor I'm watching is the bottom trend line on the SPY daily chart (in green below).
As far as I'm concerned, if this trend line holds, the market may continue to trade higher. If it breaks, stocks will almost certainly trade lower. Interestingly, the SPY hit this level almost exactly late on Friday and just barely held. Monday will be important test in determining if we bounce into the next several days or begin to trade down.
It's also important to note that we are trading within a macro bear wedge (sharp down move followed by a secondary move sharply higher), as I've mentioned previously. This means that it's only a matter of time before the market breaks, and a break of this green trend line could be a foretelling indicator of that happening.
Tuesday, August 30, 2011
No change in outlook for S&P 500
This weekend I posted that I'm expecting some short term upside on the major market indices based on sideways consolidation on their daily charts. My position remains unchanged as we've seen this scenario play out.
Yesterday the S&P 500 traded up sharply and today closed flat. If we see another one or two days of flat to moderate downside trading, I expect to see another leg up into resistance at the 1250 level. I will look to short a hit or break of this level as it will complete the macro bear wedge that's been forming on the daily chart.
If we don't see consolidation, either by a large move up or down this week, I will switch to a neutral bias on the markets and will not hold any overnight positions. Ideally, any consolidation will take place within the range of the large up move created by Monday's rally.
Yesterday the S&P 500 traded up sharply and today closed flat. If we see another one or two days of flat to moderate downside trading, I expect to see another leg up into resistance at the 1250 level. I will look to short a hit or break of this level as it will complete the macro bear wedge that's been forming on the daily chart.
If we don't see consolidation, either by a large move up or down this week, I will switch to a neutral bias on the markets and will not hold any overnight positions. Ideally, any consolidation will take place within the range of the large up move created by Monday's rally.
Labels:
consolidation,
key levels,
long,
market summary,
SP500
Saturday, August 27, 2011
What to expect from the S&P 500 this week
This week the S&P 500 is positioning for a possible move to the upside. Since the week before last, the market has bounced considerably from the 1120 level and is trading sideways under the daily 20 moving average. As long as this sideways consolidation continues, a small bullish flag pattern has the potential to play out.
A move up will have very little resistance until the 1250 level, at which point it will likely pullback. I will look to short a hit or break of this level. There will also be minor resistance at the pivot high at 1210 and the 50% fib at 1224.
My upside bias is unchanged since I suggested that a short term bottom for stocks was in after the bounce of August 8. I also think that any movement up will serve to consolidate a macro bear flag formed since the large drop in late July.
If the market fails to move up and closes below the low of 1100, the bear flag will trigger and I will change my outlook to bearish. This is a distinct possibility as the markets are still rattled by European and American debt issues. Now more than ever, it's important to trade all up moves very carefully.
![]() |
| SPX consolidating micro bull flag for potential move up |
A move up will have very little resistance until the 1250 level, at which point it will likely pullback. I will look to short a hit or break of this level. There will also be minor resistance at the pivot high at 1210 and the 50% fib at 1224.
My upside bias is unchanged since I suggested that a short term bottom for stocks was in after the bounce of August 8. I also think that any movement up will serve to consolidate a macro bear flag formed since the large drop in late July.
If the market fails to move up and closes below the low of 1100, the bear flag will trigger and I will change my outlook to bearish. This is a distinct possibility as the markets are still rattled by European and American debt issues. Now more than ever, it's important to trade all up moves very carefully.
Key medium term breakout area for TSX 60
The TSX 60 index may have some upside in its future if it can make it above a key trend line. This trend line connects the highs from July 25 to the pivot high from August 17, as outlined in the chart below.
Since Wednesday of last week, the TSX 60 index has been consolidating sideways underneath this trend line. This resulting bullish flag pattern means that the trend line should provide only minimum resistance.
![]() |
| A break of this trend line could lead to medium term upside |
Since Wednesday of last week, the TSX 60 index has been consolidating sideways underneath this trend line. This resulting bullish flag pattern means that the trend line should provide only minimum resistance.
A breakout above this trend line would be significant as this is a medium term 60 minute chart. I'll be looking to go long here for 1-3 days depending on how fast the price moves up. First resistance on any such breakout will be at the 200 moving average and the gap fill at 795. Secondary resistance will be at the pivot top at 804. A close back below the blue trend line triggers a stop out.
The XIU.to ETF is a good way to play this breakout, as well as individual stocks. If I find any stocks with supporting bullish patterns I'll post them here.
Tuesday, August 23, 2011
Trend line breakouts--identifying prevalent patterns
Every day I see hundreds of chart patterns play out. Some patterns I take note of while other less reliable ones I ignore. This can vary on a weekly or even daily basis. Today, my chart pattern of choice was the trend line breakout.
To find a trend line, simply connect multiple highs or lows with a line--the more pivots that connect, the better the trend line. Notice how this works on the SPY intraday chart below. I personally played this breakout for a move to approximately 115.25.
Trend lines are a useful addition to any trader's repertoire due to their reliability and straightforwardness in knowing when the trade is working in your favour or not. A break above the trend line is the buy signal and a break back below is the stop out.
Once a trend line has been identified on one of the major indices it's very likely that this pattern will repeat itself on individual stocks. The following charts are trades I took in sympathy to the SPY pattern above.
Identifying prevalent patterns from one day to the next is just as important as identifying key active stocks and sectors. When you see a pattern playing out in the major indices and key large cap stocks, you'll likely see it elsewhere as well. This is a strategy I use in my own trading every day.
To find a trend line, simply connect multiple highs or lows with a line--the more pivots that connect, the better the trend line. Notice how this works on the SPY intraday chart below. I personally played this breakout for a move to approximately 115.25.
![]() |
| SPY 10 min shows clear break of trend line leading to higher prices |
Trend lines are a useful addition to any trader's repertoire due to their reliability and straightforwardness in knowing when the trade is working in your favour or not. A break above the trend line is the buy signal and a break back below is the stop out.
Once a trend line has been identified on one of the major indices it's very likely that this pattern will repeat itself on individual stocks. The following charts are trades I took in sympathy to the SPY pattern above.
![]() |
| Notice the POT.to trend line double as an inverse head and shoulders pattern |
![]() |
| Trend lines can also be bought on a retest of the initial breakout |
![]() |
| The 200MA was the logical target on this SU.to trend line breakout |
Identifying prevalent patterns from one day to the next is just as important as identifying key active stocks and sectors. When you see a pattern playing out in the major indices and key large cap stocks, you'll likely see it elsewhere as well. This is a strategy I use in my own trading every day.
Labels:
key levels,
lesson,
market summary,
pot,
SPY,
TD,
trading,
trend lines
Monday, August 15, 2011
TSX levels to watch
As the markets normalize, and with US debt issues put to bed for the time being, we can again focus on secondary markets like the TSX 60.
The TSX 60 has bounced considerably from the lows made on August 8. If it continues to move up, there will be several resistance levels to look for. The first is a narrow range between the 61.7% fib retrace, the 20 moving average and the pivot low at 811. This should be very good resistance provided we don't consolidate below it for several days. If this zone is broken to the upside, look for resistance at the 50 moving average. The dominant pattern is a bearish wedge--This means I will maintain a bearish bias and look for pullbacks at these resistant levels.
On the upside, the key levels to watch are the 200 moving average and the down-sloping blue trend line. A confirmed break above these levels will signal a possible breakout and can be bought long.
Oil and other commodities will play a key role in determining the direction of the TSX. If they remain strong, favour upper levels of resistance as the TSX should remain strong in sympathy.
The TSX 60 has bounced considerably from the lows made on August 8. If it continues to move up, there will be several resistance levels to look for. The first is a narrow range between the 61.7% fib retrace, the 20 moving average and the pivot low at 811. This should be very good resistance provided we don't consolidate below it for several days. If this zone is broken to the upside, look for resistance at the 50 moving average. The dominant pattern is a bearish wedge--This means I will maintain a bearish bias and look for pullbacks at these resistant levels.
On the upside, the key levels to watch are the 200 moving average and the down-sloping blue trend line. A confirmed break above these levels will signal a possible breakout and can be bought long.
Oil and other commodities will play a key role in determining the direction of the TSX. If they remain strong, favour upper levels of resistance as the TSX should remain strong in sympathy.
Monday, August 1, 2011
Trade idea: SM long
SM has pulled back over the past week after an impressive up-trend that began in mid June. If it pulls back further, look for support between 70.50 and 71.14.
This range corresponds to three support factors: a 50% fib retrace at 71.14, a previous pivot high at 70.46 and the 50 moving average currently at 70.38.
I will look to take this trade long on a hit or break of the 50 moving average or the pivot high at 70.46--whichever comes first.
This range corresponds to three support factors: a 50% fib retrace at 71.14, a previous pivot high at 70.46 and the 50 moving average currently at 70.38.
I will look to take this trade long on a hit or break of the 50 moving average or the pivot high at 70.46--whichever comes first.
Trade idea: WFC long
WFC will hit good support at 26.88 if it continues down over the next few days.
This level corresponds to a gap fill and an important up-sloping trendline.
I will consider entering this trade on a hit of the gap fill at 26.88 and will be watching closely for it to close above the blue trendline. The closer the two levels are to each other , the better the odds of a successful bounce--this is why it's preferable for the trade to trigger in the near future.
As always, use a stop.
This level corresponds to a gap fill and an important up-sloping trendline.
I will consider entering this trade on a hit of the gap fill at 26.88 and will be watching closely for it to close above the blue trendline. The closer the two levels are to each other , the better the odds of a successful bounce--this is why it's preferable for the trade to trigger in the near future.
As always, use a stop.
Trade idea: WAG long
Walgreen Co., (WAG) will have two important support levels coming up if it continues to decline.
The first level is at 36.68 and it corresponds to a gap fill and a 50% fib retrace. The second level at 34.71 corresponds to another gap fill and a 61.8% fib retrace.
As both of these levels have multiple support factors, both can be entered long for a short term swing trade. For either of these levels, be sure to use an appropriate stop and set it to trailing once in the money.
The first level is at 36.68 and it corresponds to a gap fill and a 50% fib retrace. The second level at 34.71 corresponds to another gap fill and a 61.8% fib retrace.
As both of these levels have multiple support factors, both can be entered long for a short term swing trade. For either of these levels, be sure to use an appropriate stop and set it to trailing once in the money.
Labels:
key levels,
long,
SP500,
swing trade,
trade idea,
WAG
Trade idea: USB long
USB will have significant support at around 25 dollars if it continues to drop into this week. This level corresponds to a major daily gap fill as well as the 50 moving average.
I will look to enter USB long on a hit or break of 25, though 25.30 will also have good support as it corresponds to a 61.8% fib retrace. I'll keep a stop at a daily close below 25--higher risk traders can put their stop below 24.15.
Sunday, July 31, 2011
Trade idea: BA long
If BA slides into next week, it will hit an important support level at 64.88.
This level corresponds to a gap fill and is where the stock closed just before a sharp rally that has lasted into 2011. Market permitting, a hit of this level should lead to a significant bounce.
I will look to enter BA long on a hit or break of 64.88 and will stop out on a confirmed daily close just below. Traders willing to take on greater risk can put their stop below the nearby pivot low at 62.46.
This level corresponds to a gap fill and is where the stock closed just before a sharp rally that has lasted into 2011. Market permitting, a hit of this level should lead to a significant bounce.
I will look to enter BA long on a hit or break of 64.88 and will stop out on a confirmed daily close just below. Traders willing to take on greater risk can put their stop below the nearby pivot low at 62.46.
Saturday, July 30, 2011
Trade Idea: AEP long
If AEP trades down next week it will have strong support at 36.47, just below the current price.
This level has three factors to support a bounce: a previous pivot high, a gap fill and a 61.8% fibonacci retracement.
I will look to enter this trade long on a hit or break of 36.50, with a stop at a confirmed close below it. If by chance this level breaks, there will be strong secondary support at the 200 moving average.
This level has three factors to support a bounce: a previous pivot high, a gap fill and a 61.8% fibonacci retracement.
I will look to enter this trade long on a hit or break of 36.50, with a stop at a confirmed close below it. If by chance this level breaks, there will be strong secondary support at the 200 moving average.
Trade Idea: AA long levels
If Alcoa Inc. (AA) continues down next week, it will find support at two important levels. Both of these levels combine multiple support factors and so have a high probability of bouncing.
The first level is at 14.18 which corresponds with a previous pivot high and a 50% fibonacci retracement. The second level is at 13.16--the confluence of a 61.8% fibonacci retracement and the nearby gap fill at 13.10.
I will look to enter AA long on a break of 14.18 with a stop at a confirmed daily close just below it. If this level breaks, I will enter long again at 13.10.
As with any trade, remember to take partial profits early and use a break-even stop thereafter.
The first level is at 14.18 which corresponds with a previous pivot high and a 50% fibonacci retracement. The second level is at 13.16--the confluence of a 61.8% fibonacci retracement and the nearby gap fill at 13.10.
I will look to enter AA long on a break of 14.18 with a stop at a confirmed daily close just below it. If this level breaks, I will enter long again at 13.10.
As with any trade, remember to take partial profits early and use a break-even stop thereafter.
Saturday, July 16, 2011
AMGN Bounce Level
AMGN is very close to key support and if the market holds up next week it may bounce.
The 54.70 level corresponds to a gap fill and a 61.8% Fibonacci retrace. I'd consider taking this trade on a hit of this level with a confirmation stop just below it. If this level breaks, there will be secondary support at the pivot low of 53.16. This trade is somewhat higher risk due to the precipitous fall it has seen recently, but could bounce as it's very oversold.
If the level holds, look to take profits at the 200 moving average and use a trailing/breakeven stop thereafter.
Please be advised that if the market looks to fall early next week, I will not take this trade. Always be aware of overall market conditions when taking any trade and never fight the market.
The 54.70 level corresponds to a gap fill and a 61.8% Fibonacci retrace. I'd consider taking this trade on a hit of this level with a confirmation stop just below it. If this level breaks, there will be secondary support at the pivot low of 53.16. This trade is somewhat higher risk due to the precipitous fall it has seen recently, but could bounce as it's very oversold.
If the level holds, look to take profits at the 200 moving average and use a trailing/breakeven stop thereafter.
![]() |
| AMGN may bounce if market holds |
Please be advised that if the market looks to fall early next week, I will not take this trade. Always be aware of overall market conditions when taking any trade and never fight the market.
Thursday, July 7, 2011
Finding the Key to the Market
In any given market there is an over-arching concept or chart that can sway it one way or the other. For example, in a market driven by FX, the breakdown or breakout of a particular currency will have a direct, lockstep effect on stock and commodity prices.
Earlier this week I spoke about what I called the "FX-factor", or the affect of the Euro/US dollar coupling on the US stock market. The charts I posted showed clearly that the dollar would bounce and the Euro would fall, and that's exactly what happened. However, the market didn't react as it normally would. The USD and the SPY essentially rallied together.
There are an infinite number of reasons why this may have been the case. In my opinion, the combination of low volume and a market consumed with fundamentals like European debt and US jobs data let the major stock indices float as if in a vacuum.
The question now is what sort of catalyst will cause the markets to finally correct to a sustainable price in the short term. The S&P 500 is very close to a double top on the daily chart, but that's still another 30 points away. It's possible that we get there, but it's increasingly unlikely without first pulling back to consolidate.
While I was watching this chart today, I was reminded of early June when we were wondering where the market would bottom. If you followed me on Twitter then, you'll remember that we were looking for either a hit of the 200 daily MA or the pivot low just below it. Due to the precipitous fall we were experiencing at the time, I chose to wait for the pivot low as it had a higher risk/reward ratio of playing out in my favour.
Of course you'll also remember the SPX just barely hit the 200MA and never hit the bottom pivot before sharply reversing to the upside. The Nasdaq was a different story; it broke its 200MA and went all the way to the pivot below it. After hitting this level, the SPX, Dow, etc. all bounced sharply to the upside and the rest is history.
With this in mind consider that we're in a similar situation right now. The SPX has just broken a major pivot level and seems to be on its way further up to the double top at 1370. The Nasdaq on the other hand is very close to its double top from early May and it will only take a slight push up for it to reach this level. Following the logic that the Nasdaq led the markets up, it stands to reason that it could lead the retrace back down. This could suggest that the SPX retraces before hitting 1370.
Right now, this is all just a theory based on an observation. We'll have to wait and see how the market reacts to this level either tomorrow or the next day before concluding that it's the key to the market. I may take an additional short should the Nasdaq hit the double top target, but if we close above it I'll most likely cover the entire position and wait on the sidelines for the next trading signal.
Check back here for updates on this topic and follow me on twitter for my latest thoughts on the market.
Earlier this week I spoke about what I called the "FX-factor", or the affect of the Euro/US dollar coupling on the US stock market. The charts I posted showed clearly that the dollar would bounce and the Euro would fall, and that's exactly what happened. However, the market didn't react as it normally would. The USD and the SPY essentially rallied together.
There are an infinite number of reasons why this may have been the case. In my opinion, the combination of low volume and a market consumed with fundamentals like European debt and US jobs data let the major stock indices float as if in a vacuum.
The question now is what sort of catalyst will cause the markets to finally correct to a sustainable price in the short term. The S&P 500 is very close to a double top on the daily chart, but that's still another 30 points away. It's possible that we get there, but it's increasingly unlikely without first pulling back to consolidate.
![]() | |
| SPX still far away from 1370 double top |
![]() |
| SPX bounces sharply before hitting key pivot |
Of course you'll also remember the SPX just barely hit the 200MA and never hit the bottom pivot before sharply reversing to the upside. The Nasdaq was a different story; it broke its 200MA and went all the way to the pivot below it. After hitting this level, the SPX, Dow, etc. all bounced sharply to the upside and the rest is history.
![]() |
| Nasdaq gets huge bounce from key pivot |
With this in mind consider that we're in a similar situation right now. The SPX has just broken a major pivot level and seems to be on its way further up to the double top at 1370. The Nasdaq on the other hand is very close to its double top from early May and it will only take a slight push up for it to reach this level. Following the logic that the Nasdaq led the markets up, it stands to reason that it could lead the retrace back down. This could suggest that the SPX retraces before hitting 1370.
![]() |
| Nasdaq double top is extremely close |
Check back here for updates on this topic and follow me on twitter for my latest thoughts on the market.
Monday, July 4, 2011
FM.to Short Setup
FM.to is coming into good resistance. If the market has another leg up, this short will likely trigger sometime tomorrow.
The short is based on the hit of a double-top at 147.50 after a very extended up-move. The stop should be placed above 147.50 level, using whichever method you prefer.
![]() |
| FTS.to |
Friday, July 1, 2011
Key level: MCHP Short
MCHP is into strong resistance at the current levels. When the market pulls back, this stock should as well. I will consider shorting this stock if it pushes back to today's highs, otherwise I'll keep it on watch for next week.
There are five resistance factors here: the 50MA, gap fill, bear flag, 50% fib and a previous pivot.Good short between 38.34 and 38.67. I'll look to enter at 38.67.
Thursday, June 30, 2011
Key level: LLTC Short
Linear Tech Corp (LLTC) hit strong resistance today at $33.27 and pulled back. In the event of more upside tomorrow there will be a good opportunity for a short entry.
There are 3 resistance factors here: the 50 moving average, a gap fill and a previous pivot low. The short is valid anywhere between $33.44 and $33.61. I'll probably look to enter at around $33.50, just above the gap fill.
Wednesday, June 29, 2011
Key level: FTS.to Short
Just a few days ago, I alerted via twitter that FTS.to would have strong support at 30.80. Since then the stock has risen $1.38--not bad.
Just as quickly, FTS.to is now high on my list of stocks to short. Assuming the market has 1-2 days left of upside left before pulling back, I like the 32.40 level for resistance. There are 5 factors at this level: the 50MA & 200MA, the 50% Fib and a previous pivot low all within a bear wedge.
This is a high probability short, but if for some reason the market surges I'll be more cautious about taking a position. There is also some resistance at 32.70 and 33.85.
Update: Today FTS.to went to 32.48 early in the morning and pulled back. I shorted the retest @ 32.48 before it spiked even higher to 32.65. FTS.to then came all the way back below the resistance at 32.40, so the level is still working. We'll see what next week brings for this stock.
Just as quickly, FTS.to is now high on my list of stocks to short. Assuming the market has 1-2 days left of upside left before pulling back, I like the 32.40 level for resistance. There are 5 factors at this level: the 50MA & 200MA, the 50% Fib and a previous pivot low all within a bear wedge.
This is a high probability short, but if for some reason the market surges I'll be more cautious about taking a position. There is also some resistance at 32.70 and 33.85.
Update: Today FTS.to went to 32.48 early in the morning and pulled back. I shorted the retest @ 32.48 before it spiked even higher to 32.65. FTS.to then came all the way back below the resistance at 32.40, so the level is still working. We'll see what next week brings for this stock.
Subscribe to:
Posts (Atom)